Lean Analytics
Description
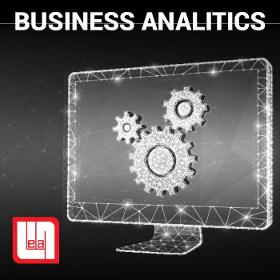
Data Visualization (Lean Analytics) allows us to access data on a computer, TV, mobile phone or any other portable device, at any time. Lean analytics (Data visualization) tailored to your needs: With the Power BI analytical tool, we create quick access to automated measurement of indicators and their visual display. Power BI ranks among the top 5 business intelligence tools that support rich analytical and visualization power to present advanced data design and analytics, such as forecasting future events based on history Lean Analytics Production management z LEAN SOLUTIONS ANALYTICS. On the digital SFM link, you can see an example of an interactive control panel for more efficient management of the production process
- Information systems - advice
- Data Visualization
- Analytics Tailored
Similar products from LEAN REŠITVE

LEAN REŠITVE
Slovenia

Lean processes: the basis of successful transformation They are the best tool on the path to excellence, achieving lasting progress and adapting business to customer requirements . The practical workshop will present in an interesting and interactive way the views and challenges that companies face in maintaining economic performance and growth . Lean processes are the basis for successful digital transformation Any organization that wants to be successful and leader in its industry in the long run must take care of the best possible use of resources and better cost management . You will be introduced to how development takes place excellent processes in a lean organization , which are a prerequisite for digital transformation . In the implementation of lean manufacturing / logistics and digital transformation employees are key to success. We will present examples of how to connect all stakeholders
LEAN REŠITVE
Slovenia
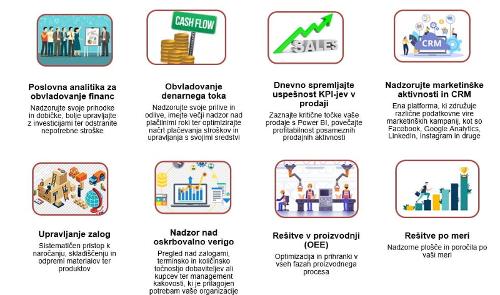
01 Lean Analytics Data Visualization (Lean Analytics) allows us to access data on a computer, TV, mobile phone or any other portable device, at any time. 02 Lean analytics (Data visualization) tailored to your needs: With the Power BI analytical tool, we create quick access to automated measurement of indicators and their visual display. business analytics tailored to your needs Power BI ranks among the top 5 business intelligence tools that support rich analytical and visualization power to present advanced data design and analytics, such as forecasting future events based on history 03 Lean Analytics Production management z LEAN SOLUTIONS ANALYTICS. On the digital SFM link, you can see an example of an interactive control panel for more efficient management of the production process
LEAN REŠITVE
Slovenia
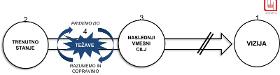
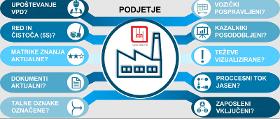
Process optimization - how to get started? Any company that wants to maintain improved processes in the long run must first consider a vision, direction or goal (1). The most effective way to successfully motivate employees is clear communication of vision, direction and goals. Process optimization requires a change in the current way of working, so it is very important for employees to identify with the vision, direction and goals of the company. Once the direction is confirmed and agreed, the current situation needs to be effectively analyzed to optimize the process (2). Understanding the current situation without subjective ballast is the key to effective process optimization. Employees directly involved in the process participate in the analysis of the current situation and systematically present the current situation using lean methods.
LEAN REŠITVE
Slovenia
Gemba walk! What is it? The term Gemba walk is derived from Japanese and means “real city” or “crime scene”. At Lean, “gemba” is the most important place for a team, as it is a place where added value is created. It is a very important part of the lean management philosophy. The purpose is to enable managers and managers to observe the actual work process, work with employees, gain knowledge about the work process and find opportunities for continuous improvement. The operator is best aware of all the problems that arise in the work process and is an excellent source of information. Before you start a tour, you need to have a plan that depends on your long-term and specific goals. You can use a checklist of questions to help you clarify the process